 By Muninder Adavelli. Scraping, SEO, and proxies for over a decade.
The first thing I researched when starting this website is - web scraping usage, who use it, how many use it, why they use it and so on - to understand the market and in the process I wrote state of web scraping in 2026. Playwright was the most discussed one there. Yet, there is much more to share about Playwright. So this seperate one about it.
Let me start this one.
How many people/devs use Playwright?
-
I see 45.1% adoption quite a lot. It is the most cited number.
-
and then there are different company count trackers. They put the range from 4,484 companies to 47,694 companies using Playwright.
-
Weekly npm downloads sit somewhere between 52M and 83M depending on when you looked.
All numbers about Playwright usage, all different and none are wrong.
They are all measuring different things from different sources and in different moments and none of them specifically measure scrapers - a number that I am very intersted in.
However, there are very interesting other numbers.
Playwright Stats at a glance
Playwright as a testing and automation tool
Playwright adoption rate is 45.1%
The first thing I search about every opensource package I use is : Who uses it, how many devlopers are using it. Thats how I gauge my trust in the software. And with Playwright, the number I see for it is 45.1% adoption rate. It originally comes from a 2025 TestGuild survey of QA professionals.
The Qauality Assurance and testing community is the subject of that resarch. NOT developers broadly, NOT data engineers, NOT scrapers.
However, the number has been travelling across in quite a few sites, often in the generalized context, turning a QA-survey result into a general "market share" claim.
In the same QA and Testing sector, 6sense's technographic database, that monitors enterprise software install counts, ranks Playwright (8.47% usage) at 5th position behind Selenium (24.81%), Azure Test Plans (18.31%), Bugzilla (17.43%), and Cypress. Both the numbers are factual. But context is the key.
The big number of 45.1% reflects likability of Playwright among QA engineers. The 8.47% is the measure of total installed base. It includes legacy Selenium deployments that haven't migrated.
However, neither of these numbers are not in my scraping context - I am seeing Playwright more as solution for scraping JS-Heavy websites.
So, I went the obvious route of looking at git and npm counts. And the numbers there blew my mind.
Playwright has a 141M WEEKLY npm downloads.
When I was looking for how many downloads playwright has, I found this
My first thought after seeing these numbers, the weekly count itself is HUGE! UNBELIEVABLY HUGE!
And then there is contrast of millions of downloads in different sources.
Looks like all these weekly download figures not measuring the same moment, same week or not even the weekly averages.
So these are not contradictions. They are points on a growth curve.
But still that million weekly count was bugging me, so I went to the source, https://www.npmjs.com/package/playwright.
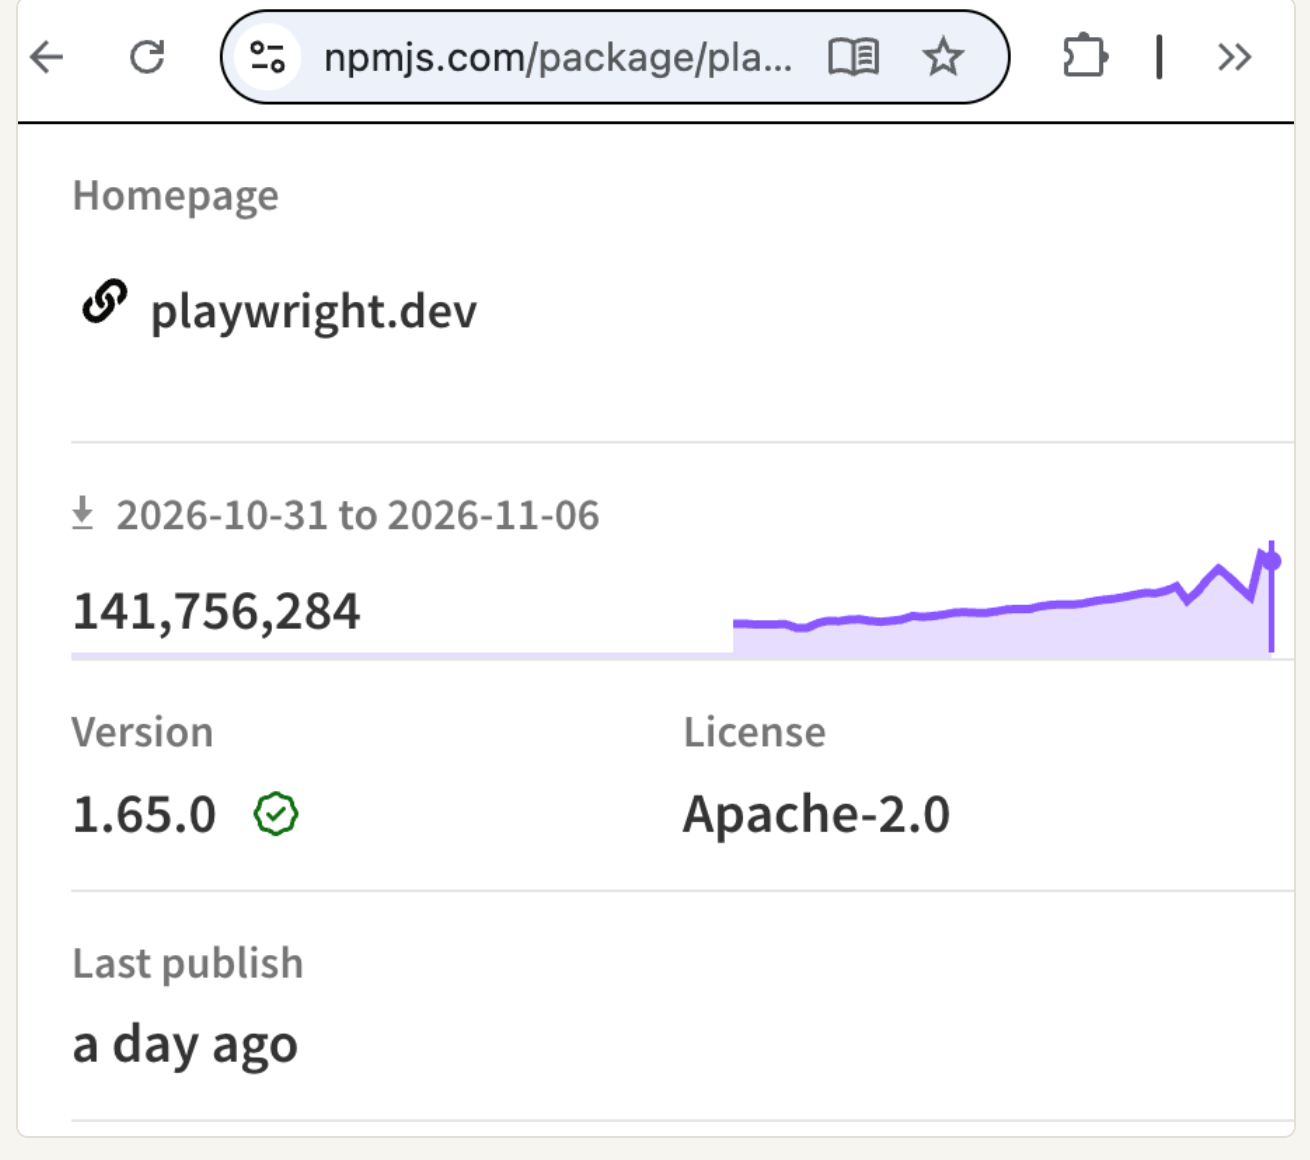
And looks like all those above numbers are correct. They were all points on the growth curve.
But they are still unbelievable. So I looked deep.
These millions of weekly download counts is inflated.
How?
npm counts every install event. A CI/CD pipeline that reinstalls dependencies on each of 50 daily builds generates thousands of weekly downloads from a single project. Test frameworks live in devDependencies and get reinstalled constantly.
The 141M figure is not 141M unique users or active projects — it is 141M install events across all build environments.
So, I decided to pitch Playwright against others with the same source: npmjs
And that clearly shows how popular Playwright right now is. Especially after Claude democratized the dev work. And may it is one of the contributor to growing bot traffic.
Coming back to playwright growth, it leads the downloads game, which in a way represents the usage. It leads by a large margin:
This really gives a clear picture of how big playwright has become. It is used 23 times more than its closest contender in both scraping and automation.
Weekly npm downloads, Nov 2026. npmjs.com.
After npm, the next big thing I wanted to check to evaluate Playwright usage is github.com
Playwright has 99,500 stars, 550,000 dependent repos on Github.
The official microsoft/playwright repository reached 99,500 stars and 6,800 forks by November 2026.
And, there are 550,000 public repositories that use Playwright as a dependency.
These numbers already gives me a clear picture of how big it is. But I also wanted to make sure, how its growing in the recent times, especially after the vibe coding encouraged many to code.
Playwright Growth in 2026
In May 2026, it was roughly 500,000 public repos using it as a dependency. And now its 550K. Thats a 10% growth in 6 months.
These numbers already paint that positve growth and appreciation from the community picture.
But lets take it a notch further.
Playwright Usage vs Selenium and Cypress in 2026
Playwright Users by Programming Language Distribution
Playwright supports TypeScript, JavaScript, Python, Java, and .NET (C#) with native bindings. No third-party plugins, packages or warappers needed. One reason, it has become a universal tool for all automation, testing and scraping devs using all types of programming languages.
The user distribution, per Aims-ai's 2026 survey
The GitHub codebase itself is 91% TypeScript. Thats expected for a Microsoft project, and not a signal of user language preference. The 20% Python figure is the one that matters for scrapers: Python installs Playwright via pip install playwright, which means 20% of the user base is completely invisible to npm download counts.
So I also collected pypi numbers.
Playwright Python: 97M monthly PyPI downloads
microsoft/playwright-python has the python bindings for playwright and ship it as a separate package on PyPI. And according to that pypistats.org/packages/playwright data, playwright Python package has 97M downloads per month and 31M per week.
These figures are not included in the npm numbers that we were talking before.These are Python-only installs. Numbers that represent the data engineers, scrapers, and automation scripts that never touch Node.
When you add this to the npm figure, the combined install volume is substantially larger than any single-source number suggests.
The microsoft/playwright-python GitHub repo itself has 15,100 stars and 1,300 forks — a separate repository from microsoft/playwright (99,500 stars), maintained exclusively for the Python bindings. For context, the entire SeleniumHQ/selenium repo sits at 34,600 stars across all language bindings. Playwright's Python-only repo alone is at 44% of that. The Python adoption is not a footnote.
31M python usage + 141M npm downloads per week - That I think is huge.
I also want to speculate that most of this python numbers represent the scraping and autoamtion community.
Now, that the speculation part is done, lets get into real numbers. Real playwright statistics for scraping community.
Sources: testguild.com, 6sense.com, aims-ai.com, testdino.com, leapwork.com, npmjs.com, github.com, pypistats.org
Playwright in the scraping community
Firstly, let me clarify. Playwright started as an end to end browser testing QA tool. Mostly targeted at enterprise level software devlopment teams that have software code testing as a department.
But, everyone from autoamtion, scraping communities owned it more than testing departments.
Why did scraper and automation enthusiasts adopted this testing tool
Scraping community adopted it for three following reasons.
-
Single API for multi-browser support. Playwright for its testing tasks, comes with Chromium, Firefox, and WebKit as browser engines. In the processing of scraping different websites, we come across different challenges. For instance there are websites that block bots and scripts with fingerprinting. First mode of action against that block is try different browsers. And with Playwright now I can do that all in one without having to switch browsers and deal with exploded maintenance time and cost.
-
Python bindings (released 2020). The data-engineering stack runs on Python. Playwright's Python bindings brought it into that world without requiring JS. Puppeteer never had this.
-
Speed. In terms of real browser based scraping, Playwright's headless execution benchmark: 14 seconds. Cypress: 24 seconds. Puppeteer: ~21 seconds. That might look small, but when measured at scale, it compounds big.
The stealth signal: playwright-stealth and invisible_playwright
The clearest proxy for scraping-specific Playwright adoption is not in any download tracker or company-count database. It is in the GitHub star counts for the stealth wrapper libraries built on top of Playwright — tools that exist for one purpose only: evading anti-bot systems.
I am pretty sure, no one from QA or testing perspective have stared playwright_stealth or invisible_playwright or fork built these from playwright. Every one of those 3,591 combined stars is a scraper or automation engineer. The numbers might look smaller than the main Playwright repo, but they are cleaner signal of Playwright popularity as scraping engine.
The playwright-mcp, is quite new and numbers for it are also remarkable: 39,300 stars for a package released to let AI agents control browsers. That is 40% of the main Playwright repo's total star count, accumulated in very small time compared to main repo. It sits in neither the QA-survey population nor the scraping populationit is a third category of Playwright use that download counts are only beginning to reflect.
For comparison, the Selenium GitHub repo (SeleniumHQ/selenium) has 34,600 stars across all language bindings combined. invisible_playwright alone, a single Python anti-detect Fork has got 2,600 stars, which is 7.5% of Selenium's entire GitHub presence, for a tool that has no QA use case whatsoever.
Playwright vs Selenium in scraping
By every growth metric Playwright has surpassed Selenium. The enterprise install base is a different picture:
The difference tells the story: Playwright is newer age tool for small, big and mid sized teams. Selenium wins the legacy race. For scraping especiallly, the multi browser engines concept made playwright a defacto scraping engine for all, most importantly those using Python.
Sources: github.com, 6sense.com, theirstack.com, npmjs.com
The company-count tracker problem: 4,484 vs 47,694
Four trackers, four different answers to "how many companies use Playwright?":
I dont think this 10.6x gap between Landbase and Theirstack numbers is an error or wrong data collection. They are just collecting different things. 47,694 / 4,484 = 10.63x. Landbase collects only counts what is publicly declared in open-source repos.
Theirstack counts any public mention of the technology.
Company count estimates by tracker, 2026. Same technology, 10x range due to methodology differences.
Sources: landbase.com, testdino.com, aims-ai.com, 6sense.com, theirstack.com
What this data cannot tell us
1. What share of Playwright installations are running scraping jobs vs QA pipelines.
No public tracker separates Playwright usage by intent. The 4,484 Landbase companies and 47,694 Theirstack companies are both company counts and neither breaks down whether those companies are using Playwright for browser testing, CI/CD, or data extraction. There is no survey that has asked this question of a scraping-community sample.
2. How many Python users are using Playwright for scraping.
PyPI tracks playwright-python downloads, but that count is not publicly aggregated alongside the stealth-wrapper packages (playwright-stealth, undetected-playwright) that mark specifically scraping use. The 20% Python share from aims-ai is a user-language breakdown, not a use-case breakdown. We know the signal exists; we cannot quantify it cleanly.
3. Whether the enterprise migration from Selenium to Playwright is happening in scraping workloads specifically.
6sense and Theirstack both show Selenium ahead on company count. But neither source breaks down whether Playwright adoption is in QA or scraping. The migration may be entirely in QA teams, leaving the scraping install base still Selenium-dominant. The data does not distinguish.
4. What the actual lifecycle of a scraping-specific Playwright project looks like. The 94% retention figure is from QA teams running long-running test suites. Scraping projects are often bounded and task-specific — a scraper might use Playwright intensively for a month then be replaced when the target changes. That would look like abandonment in a retention survey. No survey has collected lifecycle data from scraping teams specifically.
Sources: landbase.com, theirstack.com, aims-ai.com, 6sense.com, browserstack.com
Calculations Used
10.6x gap between Landbase and Theirstack. 47,694 / 4,484 = 10.63x. Source for 47,694: Theirstack technology intelligence, Nov 2026. Source for 4,484: Landbase technographic database, 2026.
Playwright leads Selenium by 188% in GitHub stars. (99,500 - 34,600) / 34,600 x 100 = 187.6%. Both figures: GitHub repository star counts, Nov 2026 snapshot.
Playwright npm downloads are 83x selenium-webdriver. 141,700,000 / 1,700,000 = 83.4x. Both figures: npm public registry, Nov 2026.
3,791% growth claim does not reproduce. Claimed inputs: 1.2M (Jan 2022) and 52M (May 2026). (52 - 1.2) / 1.2 x 100 = 4,233% — not 3,791%. The discrepancy is 442 percentage points. Likely cause: different baseline date or snapshot used by original source.
45.1% adoption vs 8.47% market share — both correct, different populations. 45.1%: TestGuild Annual Survey 2025, self-reported usage by QA professionals. 8.47%: 6sense enterprise technographic database, Testing & QA category install base, 2026. These are not in conflict — they measure different things.
Sources: theirstack.com, landbase.com, github.com, npmjs.com, testguild.com, 6sense.com
Updates log
- Initial publish.
Sources
Every stat above was cross-checked against these public sources. Links kept honest and unshortened.
Adoption surveys
- TestGuild: Annual Survey 2025https://testguild.com
- aims-ai: Playwright Statistics and Market Share 2026https://playwright.aims-ai.com/blog/playwright-statistics-market-share-2026
Technographics & company trackers
- 6sense: Technographics Testing & QA 2026https://technographics.6sense.com/testing-and-qa/playwright-market-share
- testdino: Playwright Market Share 2026https://testdino.com/blog/playwright-market-share
- Landbase: technographic database 2026https://data.landbase.com/technology/playwright/
- Theirstack: technology intelligence Nov 2026https://theirstack.com/en/technology/playwright
npm & PyPI download data
- npm: playwright package weekly snapshots 2022-2026https://www.npmjs.com/package/playwright
- pypistats: playwright Python package statshttps://pypistats.org/packages/playwright
GitHub repositories
- GitHub: microsoft/playwrighthttps://github.com/microsoft/playwright
- GitHub: microsoft/playwright-pythonhttps://github.com/Microsoft/playwright-python
- GitHub: AtuboDad/playwright_stealthhttps://github.com/AtuboDad/playwright_stealth
- GitHub: feder-cr/invisible_playwrighthttps://github.com/feder-cr/invisible_playwright
- GitHub: microsoft/playwright-mcphttps://github.com/microsoft/playwright-mcp
- GitHub: SeleniumHQ/seleniumhttps://github.com/SeleniumHQ/selenium
Industry reports
- Leapwork: Rise of Playwright 2026https://leapwork.com/blog/rise-of-playwright/
- InfoQ: Leapwork Play GA Nov 2026https://infoq.com/news/2026/11/leapwork-play-playwright/
- BrowserStack: Essential QA Metrics 2026https://www.browserstack.com/guide/essential-qa-metrics
- Precedence Research: Automation Testing Market Size 2025-2034https://www.precedenceresearch.com/automation-testing-market